

/image%2F0989404%2F20250225%2Fob_deaf60_on.png)
/image%2F1279849%2F20260803%2Fob_9cd02d_.png "Apprenez ces 8 techniques de vente pour passer de novice à vendeur hors pair")
/image%2F1279849%2F20260724%2Fob_a1e3c7_.png "Comment les RH peuvent utiliser des graphiques pour planifier les efforts de recrutement et de formation")
/image%2F1279849%2F20260525%2Fob_a3780e_6a0ac5b5225649027f229ca6.png "Detailed Explanation of Technical Architecture Diagrams: An Essential Tool for System Design")
/image%2F1279849%2F20260423%2Fob_9f4e54_6949f51eb0910e26735e47b8.png "IA et cartographie mentale : le chemin complet de l’idée à la mise en œuvre")
/image%2F1279849%2F20250521%2Fob_66ac62_20250521103650.png "Tutoriel détaillé sur l'éditeur de formules MathType, même les novices peuvent facilement commencer")
/image%2F1279849%2F20250516%2Fob_a0217a_20250516145145.png "Guide d'utilisation de l'éditeur de formules Math99 LaTeX : l'arme secrète pour l'édition de formules en ligne")
/image%2F1279849%2F20250425%2Fob_0e6aab_66cd95a2e15a6954b050577e.jpeg "Conseils de création de diagramme de relation de personnes partager avec les modèles de diagramme de relation HD populaires")
/image%2F1279849%2F20250421%2Fob_fc1d1c_670c8b92bcfea16d6cf0c6a2.png "Qu’est-ce que la gestion du calendrier de projet ? Indispensable pour les chefs de projet")
/image%2F1279849%2F20250418%2Fob_c1a57a_66e29b4f8f18797709d64b9a.png "5 schémas d'architecture produit incontournables, indispensables pour devenir directeur produit d'un grand constructeur")
/image%2F1279849%2F20250411%2Fob_7c3bd9_66e252898f18797709d6471e.png "Compréhension approfondie du BPMN : un outil puissant pour la gestion des processus")
Detailed Explanation of Technical Architecture Diagrams: An Essential Tool for System Design
Technical architecture diagrams have become an indispensable tool for enterprise technology teams. They are not only a visual representation of system design but also a core vehicle for team collaboration, technical decision-making, and business communication. Whether it's microservices, cloud-native technologies, or traditional monolithic applications, a clear technical architecture diagram helps everyone—from the CEO to frontline developers—understand how the system is structured, how components collaborate, and how data flows.
This article will provide an in-depth explanation of technical architecture diagrams, covering topics such as what a technical architecture diagram is, common types of architecture diagrams, core elements for drawing them, and standard steps, helping you to fully master this tool.
I. What is a technology architecture diagram?
A technical architecture diagram is a visual model that describes the overall structure, component division, interaction relationships, deployment methods, and technology selection of a software system. It's not just for programmers; product managers, testers, operations engineers, and
even stakeholders without a technical background can benefit from it. Through an architecture diagram, the team can:
Unified understanding: Ensure that everyone has a consistent understanding of the system's scope and boundaries.
Identify risks: Proactively identify single points of failure, performance bottlenecks, and security vulnerabilities.
Development guidance: serving as the basis for module division and interface definition.
Convenient operation and maintenance: Deployment, monitoring, and expansion are all systematic and follow-up procedures.
II. Four Common Types of Technical Architecture Diagrams
Depending on the perspective, technical architecture diagrams are generally divided into four categories.
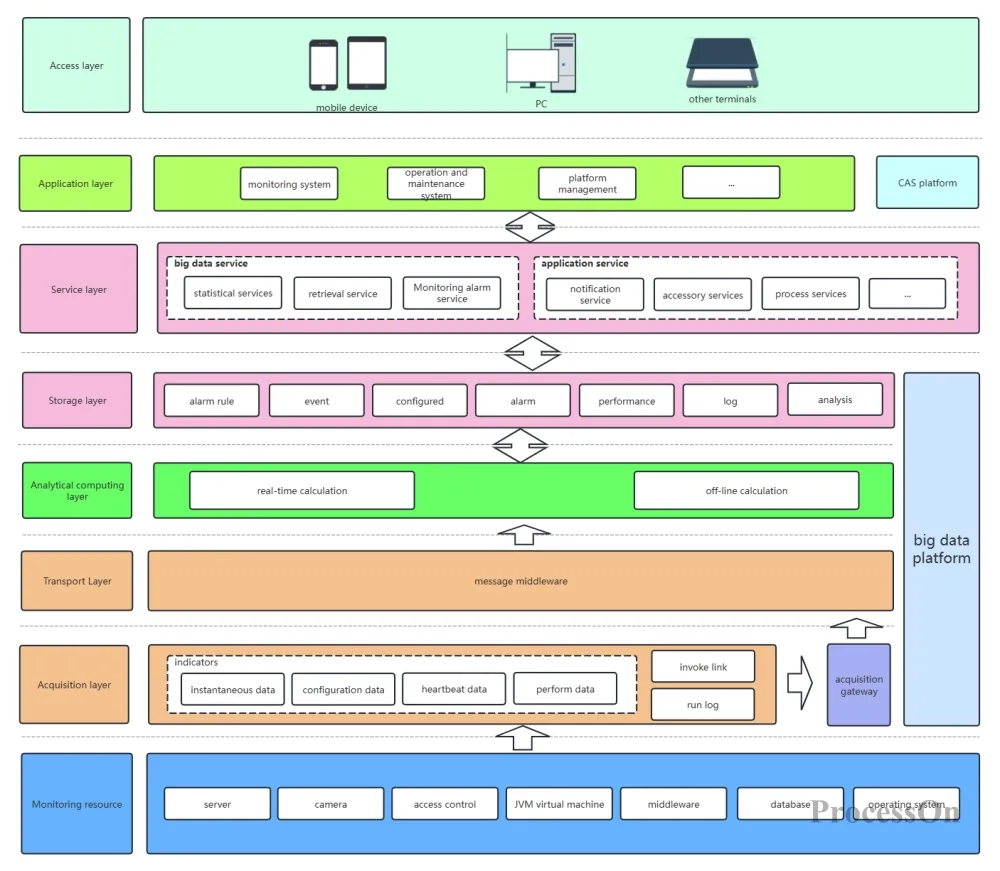
Focus areas: High-level system components and their relationships with external systems.
Included elements: Business systems, third-party services, databases, message queues, gateways, etc.
Applicable scenarios: Demonstrating overall solutions to non-technical personnel, such as "An e-commerce system includes a user interface, merchant interface, backend management, payment gateway, and logistics interface."
Key considerations: Application internal module division, responsibility boundaries, and dependencies.
Common architectures: Layered architecture (presentation layer, business layer, data layer), hexagonal architecture, microservice call chain.
Applicable scenarios: Guiding development teams in module design, such as "order service depends on user service and inventory service".
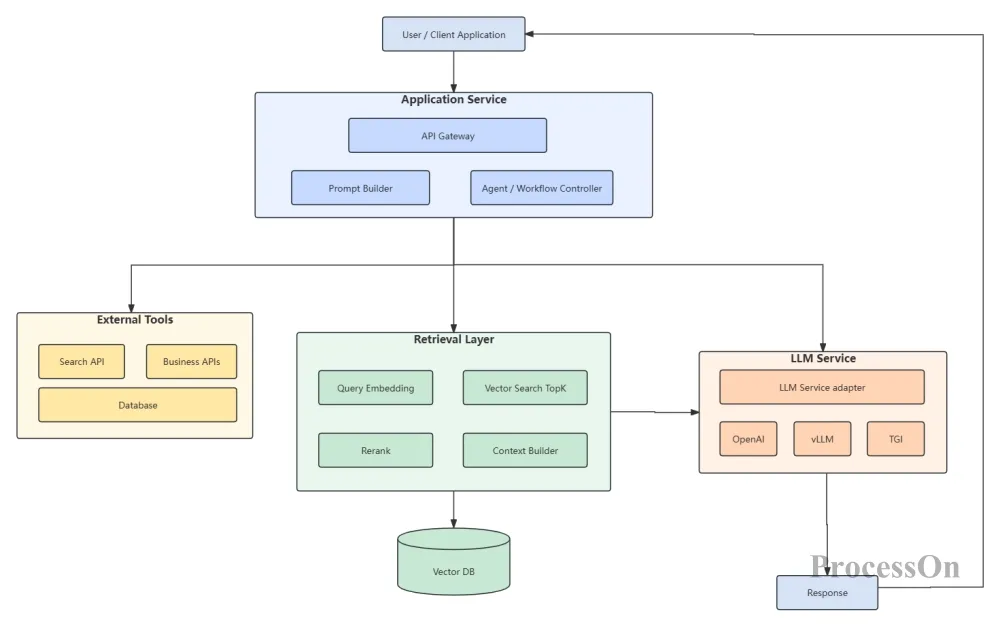
Application Architecture Diagram
Key focus areas: data model, storage solutions, data flow.
Elements included: database tables, data lake, ETL process, message pipeline.
Applicable scenarios: data warehouse construction, big data platform design, data governance.
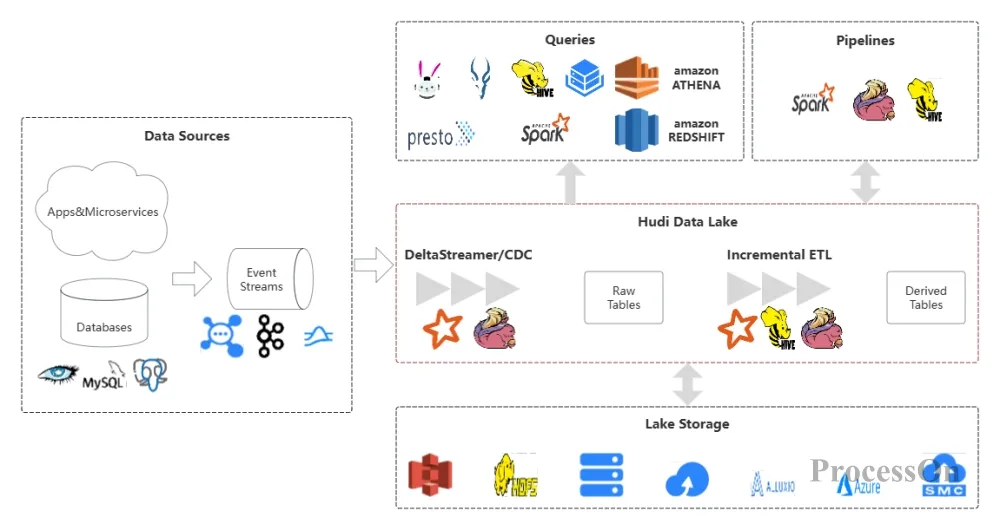
Key considerations: Physical or cloud resource distribution, network topology, and high availability design.
Includes: Servers, load balancers, CDN, and container orchestration nodes.
Applicable scenarios: Operations planning, capacity assessment, and disaster recovery solutions.
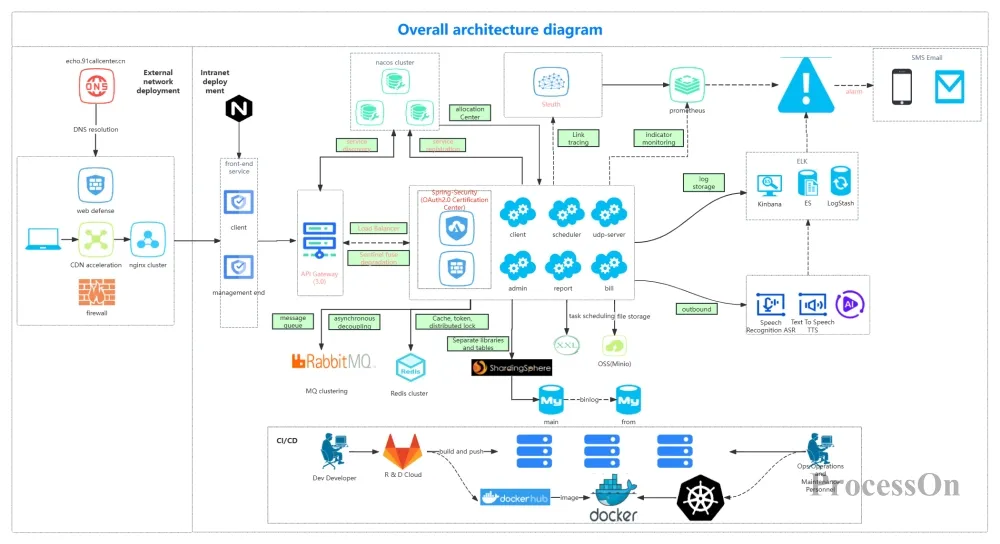
Deployment Architecture Diagram
In practice, an architecture diagram can combine multiple perspectives. For example, the C4 model (Context, Container, Component, Code) provides a hierarchical view from macro to micro.
III. Core Elements of a Technical Architecture Diagram
Regardless of the type of architecture diagram, it cannot be separated from the following four core elements:
Component: A unit with specific functionality that can be deployed independently, such as a microservice, database, or message queue. It is typically represented by a rectangle in a diagram.
Interface: The API, protocol, or event provided by a component to the outside world. Represented by a line followed by a label (RESTful, gRPC, Kafka Topic).
Data Flow: The path and direction of information transfer between components, represented by arrows, and can include data formats (JSON, ProtoBuf).
Dependency: The calling, association, or inheritance relationship between components. Different styles of connections are used to distinguish them (synchronous vs. asynchronous, strong dependency vs. weak dependency).
In addition, it may also include:
Boundary: such as network security zone, business domain bounded context.
External roles: such as users, administrators, and third-party systems.
Technology stack label: such as "Java 17 + Spring Boot" or "PostgreSQL 14".
IV. How to draw an excellent technical architecture diagram?
The following is a reusable standard process.
For the CTO? Highlight business value and technical decisions. For the development team? Emphasize module responsibilities and interface specifications. For operations ? Focus on deployment topology and monitoring alerts. The granularity of the graph depends on the target audience.
This includes: business requirements documents, a list of existing systems, interface protocols, deployment environments, etc. An architecture workshop can be organized, allowing stakeholders to draw their understanding of component relationships on a whiteboard.
I recommend using ProcessOn—an online diagramming tool that supports drawing architecture diagrams, flowcharts, UML diagrams, and mind maps. It requires no installation, has a rich selection of templates, and supports real-time collaboration among multiple users.
First, draw the main components and the connections between them. Follow the data flow principle from left to right or from top to bottom. Avoid too many intersecting lines.
Add clear and easy-to-understand names to each component , label the protocols (HTTP/WebSocket/AMQP) for key interfaces , distinguish between production and testing environments (using colors or dashed boxes) , and use illustrations to explain the meaning of line styles and colors.
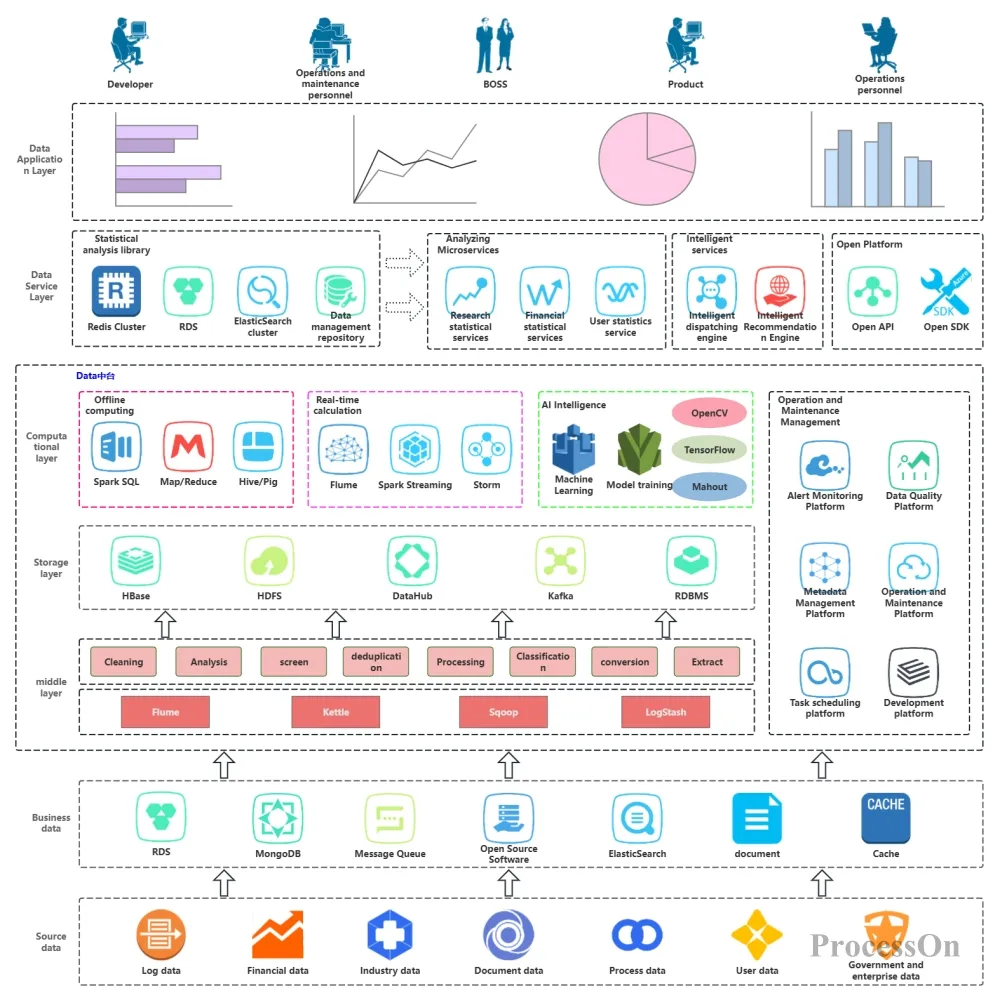
Technical architecture diagram
Invite architects, development leads, and operations engineers to review the project. Common feedback includes: missing components, incorrect arrow direction, and unreasonable layering. Make at least 2-3 rounds of revisions based on the feedback.
Embed the final architecture diagram in the document center. Whenever there are significant changes to the architecture (such as adding a new service or splitting a database), the architecture diagram must be updated accordingly.
V. Best Practices for Drawing Technology Architecture Diagrams
Prioritize readability in architecture diagrams : Since the purpose of an architecture diagram is to convey information, readability is crucial. When drawing an architecture diagram, pay attention to reasonable layout and avoid overcrowding of elements; use concise and clear labels and annotations, avoiding overly technical jargon; maintain consistency in the graphical elements so that readers can quickly identify different types of components.
Use standard symbols: For example, cloud vendor icons (AWS, Azure, Alibaba Cloud) have corresponding vector graphics, and ProcessOn has a large built-in icon library.
Unified naming convention: Component names should follow the format of "noun + type", such as "order service" or "user database".
Label non-functional requirements: For example, "99.99% availability required" and "response time <100ms" can be written directly next to the component.
Establish an architecture diagram maintenance mechanism : As the system evolves, the architecture diagram needs to be updated in a timely manner to maintain its value. The team should establish a clear architecture diagram update process to ensure that every system change is reflected in the architecture diagram promptly. Simultaneously, a version management mechanism for the architecture diagram should be established to record its evolution, facilitating the team's ability to review historical versions .
Whether you are a technical or non-technical person, mastering knowledge of technical architecture diagrams can help you better understand system design and improve communication efficiency. This article aims to help readers gain a deeper understanding of technical architecture diagrams and apply them flexibly in their work.
Author:Skye , ProcessOn Chief Operating Officer (COO)
Article from:《Detailed Explanation of Technical Architecture Diagrams: An Essential Tool for System Design》


/image%2F1279849%2F20250418%2Fob_cf4ed3_1.png)
/image%2F1279849%2F20250418%2Fob_af21de_2.png)
/image%2F1279849%2F20250418%2Fob_5d5d5d_3.png)
/image%2F1279849%2F20250418%2Fob_0043a5_4.png)
/image%2F1279849%2F20250418%2Fob_a725a7_5.png)
/image%2F1279849%2F20250418%2Fob_92a9f9_6.png)
/image%2F1279849%2F20250407%2Fob_f93139_1.png)
/image%2F1279849%2F20250407%2Fob_3bd2ea_2.png)
/image%2F1279849%2F20250407%2Fob_3a87c6_3.png)
/image%2F1279849%2F20250407%2Fob_2cd844_4.png)
/image%2F1279849%2F20250407%2Fob_8b1339_5.png)
/image%2F1279849%2F20250407%2Fob_4cb50f_6.png)
/image%2F1279849%2F20250407%2Fob_ecb2e4_7.png)
/image%2F1279849%2F20250407%2Fob_a53f27_8.png)
/image%2F1279849%2F20250407%2Fob_ee4fa0_9.png)
/image%2F1279849%2F20250407%2Fob_f7b9be_10.png)